


When I sat down to write this column, I did so with one simple question that I wanted answered: Do daily fantasy baseball salaries correlate with on the field success for the actual teams they play for? More simply put, does a higher daily fantasy baseball salary total for a team give that team a better chance of winning a given game? To answer that question, I spent three weeks (stats compiled 8/7/15 – 8/27/15) taking down the salary of every player and adding up the team totals to find out what the results would look like over that three-week span.
Let’s back up a step. For those of you who follow fantasy sports, which, if you’re reading this, I assume to be 100% of you, I am sure you are aware of the massive market that now exists for daily fantasy sports leagues. If you’re not, you will be soon.

In this particular column, we’re going to be focusing on fantasy baseball and we will be using the FanDuel dollar amounts as opposed to DraftKings for no particular reason other than it was the one I chose. The way FanDuel baseball leagues work is as follows: The site assigns salary values in dollars to all players in their system. The FanDuel player then has $60,000 to spend on a team consisting of the following positions: C, 1B, 2B, 3B, SS, OF, OF, OF, SP. The batting salaries usually vary from $2,200 up to $6,000. The pitching salaries can be as low as $3,000 but usually no lower than $4,500 and as high as $13,000 for someone like Kershaw.
![]()
FanDuel points are calculated as follows: For the starting pitchers, four points are awarded for a win, 1 point for a strikeout, 1 point for an inning pitch (fractions included, so 1/3 of an inning gets 1/3 of a point), and -1 point for an earned run. For the hitters, 1 point for a single, 2 points for a double, 3 points for a triple, 4 points for a home run, 1 point for a walk, 1 point for a hit by pitch, 1 point for a run, 1 point for an RBI, 2 points for a stolen base, and -0.25 points for an out.
In looking at the scoring, a few things jump out. First, bullpens are completely ignored. Second, there are no points for defensive efficiency for the fielding players. Third, pitchers are rewarded for striking guys out and even more so for getting the win. As to the hitters, they are rewarded for getting on base (as long as it’s not via an error or GIDP), stealing bases, and they are awarded for run production.
For the sabermetrics community, there’s some to like there and there is some not to like. I am sure that they like awarding getting on base and not getting out as hitters. I am sure they also like awarding K’s for pitchers. They probably do not like the ignoring of defense and they definitely do not like stolen bases.
All in all, I like the way FanDuel calculates its points and in making my hypothesis, I thought that the FanDuel dollars would indeed correlate with team wins. I was worried that bullpens were given zero input, especially after watching the Dodgers bullpen stink up the joint lately, and by lately, I may as well include the past decade.
In terms of its business, FanDuel makes its money by taking 10% of all the money wagered. As such, they have no incentive for trying to get entrants to favor one player over another. It does nothing to their bottom line. Therefore, the values set, according to a FanDuel formula, which has not been made public, are usually reflective of the player’s value at that time. The formula seems to weigh recent success quite highly, but not as highly as it does in football where there are such far fewer games. The formula also takes Coors Field into account, so we had to undo that Coors boost when calculating the player averages. We also had to adjust for the DH. To do that, if a team had a DH, we added up the 9 hitters salaries, divided by 9 to get the average batter’s salary for that team that day and then multiplied by 8 to account for the 8 position players. Then, we added in the pitcher’s salary and divided that total by 9. If the team had no DH, we just added up all 9 of the salaries and then divided by 9.
To show you what we did, below is the chart compiled for games played on August 25, 2015:
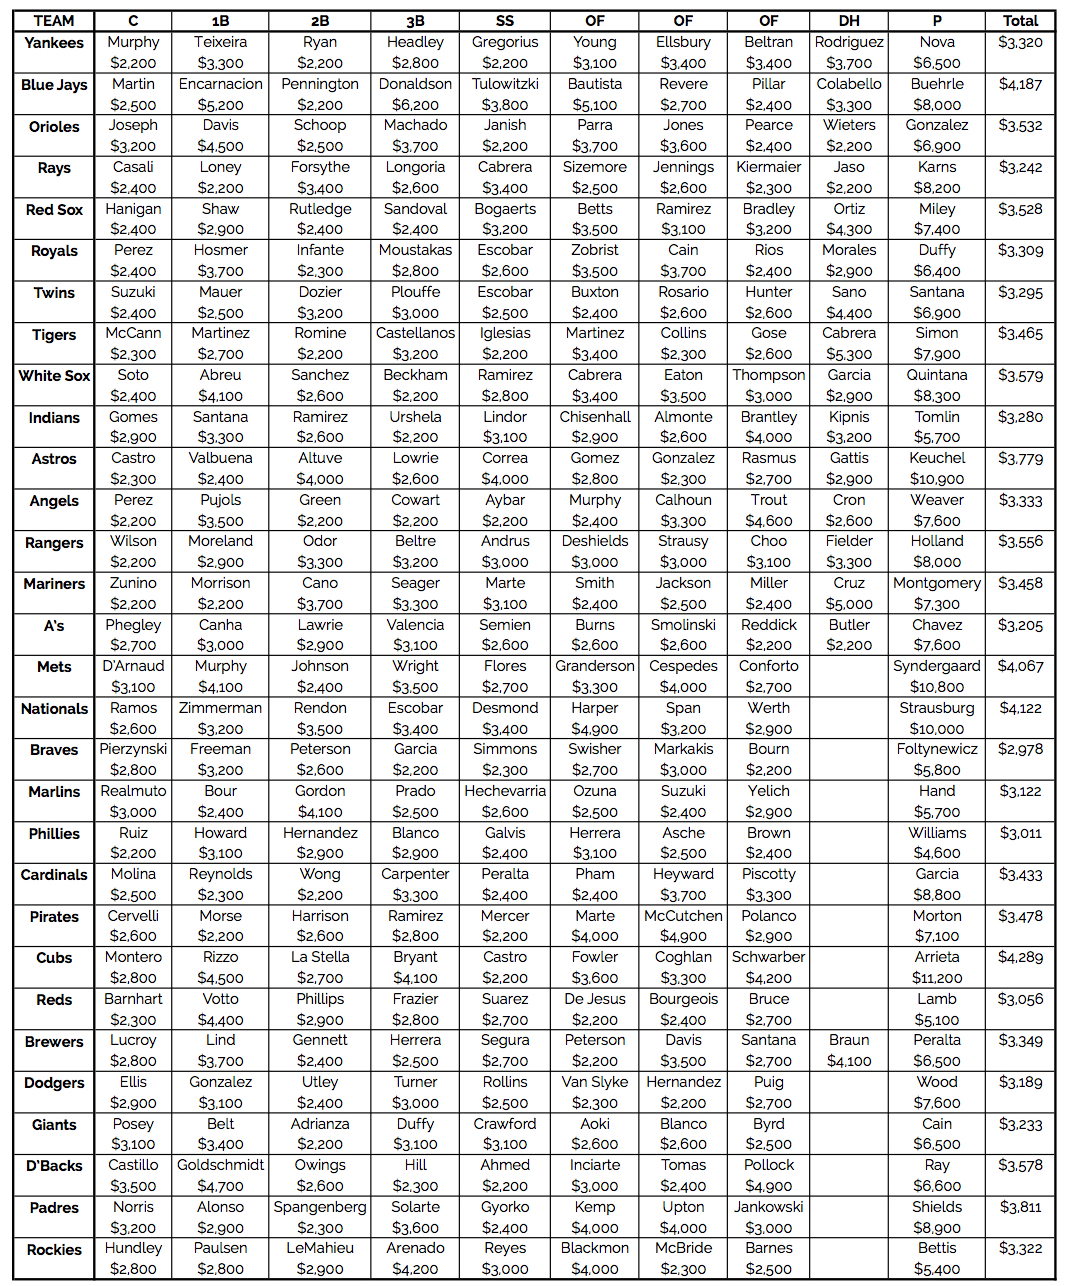
One of the things that became really annoying was trying to fit a name like Saltalamacchia into a box when he started in place of Castillo. I decided finally to shorten his name to “Salty.”
Continuing on, below is how the three-week study turned out. The numbers on the top represent the difference between number of FanDuel points that the favorite and the underdog had when they played. For example, the Astros’ total salary on August 25, 2015 was $3,779 and the Yankees’ total was $3,320; therefore, this game went in the 400-499 column as the Astros’ salary was $459 more in FanDuel dollars than the Yankees. The Astros won the game, so the record for that column was 1-0 for that specific game. Had the Yankees won, the record would have been 0-1. The total column reflects the record of all of the favorites as calculated by average FanDuel dollar per player on each team.

So what do we do with those numbers? The 164-115 record is approximately a 59% win percentage. Only two teams in the league have a better winning percentage right now (Cardinals, Royals, and Pirates). Extrapolating that to a full MLB season, that’s a 95-67 record. Below is the tally for FanDuel daily dollar averages over the course of the three weeks I tracked them:
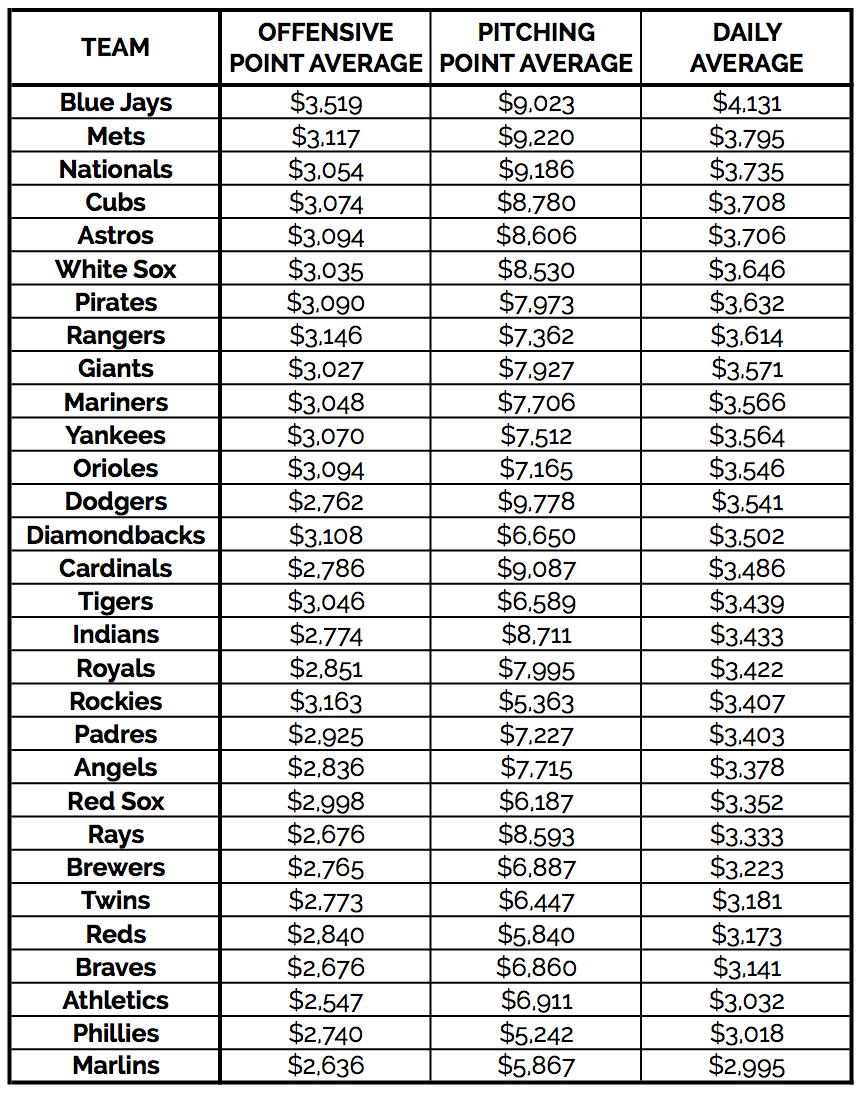
The FanDuel dollar way of tallying does not necessarily translate to a single team’s winning over the course of the season. But as we saw above, it gives you almost a 60% prediction percentage for individual games and a 64% winning percentage for teams favored by over 500 FanDuel dollars in a day. The chart also looks pretty predictive as far as telling us which teams are going to be doing the lion’s share of the losing over the course of a season. Here’s the current MLB Standings if you don’t believe me. The basement looks awfully similar and the teams at the top of the FanDuel money list aren’t too far off in the real life standings, with the exception of the White Sox, who just can’t get it together. All of that said, the Cardinals and Piratess may be winning consistently throughout the current season, but how are teams constructed like them doing in the postseason? And by teams like them, I mean teams with meh starting pitching and solid, if not overwhelming, lineups. Not too great. So who is winning in the postseason?
I’m sure you haven’t forgotten about Madison Bumgarner’s dominance last season, one of, if not the most epic pitching performances in playoff history. 2013 featured Jon Lester winning two games in the World Series 8-1 and 3-1 and Lackey winning the clinching game 6-1. 2012 had the Giants shutting out the Tigers in two games of the four-game sweep and Zito giving up only one run in another of those games. 2011 was more of a slugfest between the Cardinals and the Rangers, but the Cardinals’ Chris Carpenter opened and closed the series with quality starts and wins for his team. In 2010, the Giants won in 5 games over the Rangers with two of the wins coming by way of shutout and a third game giving up only one run. Shall I keep going or have you had enough?
The point is, yes, it helps to have a great offense, but dominant starting pitchers have been winning the day, at least in this decade. Does a solid bullpen help? Sure, but if you have a solid enough offense, your bullpen can be mediocre if you throw Madison Bumgarner out there three in seven games. Also, the list above takes into account a team’s complete rotation. When you get to the playoffs, you shorten that rotation by at least one. The Mets are going to be leaving Colon or Niese out of their rotation, making it so that in three out of every four games, their opponents are facing deGrom, Harvey, or Syndergaard. Not exactly chopped liver.
To conclude, if the playoffs had started on August 28 (the day after I stopped compiling the stats), I’d have had the Blue Jays over the Mets but I would have thought long and hard about going the other way because of the ridiculousness of the Mets’ top three starting pitchers. Check and see how those daily fantasy salaries are looking closer to the end of the year and see if they correlate to playoff wins. If they don’t, it’s fine, I only wasted 40 hours of my life collecting data for and writing this column. No biggie.